
Most CMMS Evaluations Ask the Wrong Questions
A practical guide to evaluating CMMS software using real maintenance workflows, user adoption, implementation readiness, compliance, and long-term value—not feature checklists alone.
Read article
Costs & Downtime
Maintenance problems become expensive when managers cannot see where time, cost, downtime, repeat issues, and workload are hiding. MaintBoard helps teams turn daily maintenance activity into clearer records, reports, and decisions.
Who feels this problem
For plant heads, facility managers, maintenance managers, reliability teams, and operations leaders who need better visibility into downtime, cost, workload, and repeat issues.
These are the everyday signs that maintenance work is becoming harder to track, prove, or control.
Managers know maintenance is busy, but cannot see where time is going.
Downtime is discussed but not tracked consistently.
Maintenance cost is visible only after it becomes too high.
Repeat issues, delays, and overdue work are hard to compare.
Energy waste or utility issues are noticed late.
Reports take too much manual effort to prepare.
Downtime and cost blind spots happen when maintenance activity is recorded only as scattered notes, Excel sheets, emails, or informal updates. Without structured records, managers cannot easily see patterns, repeated delays, high-cost assets, or the real impact of maintenance work.
MaintBoard helps teams move away from scattered updates and manage maintenance work with clear owners, due dates, history, and proof.
Track work orders, downtime, time spent, parts used, and completion status.
Keep asset-wise and location-wise maintenance history.
Show overdue work, repeat failures, workload, and maintenance trends.
Help teams review MTTR, MTBF, backlog, cost, and downtime patterns.
Connect energy or meter-related readings to maintenance visibility.
Reduce manual effort needed to prepare maintenance reports.
MaintBoard is not meant to add more confusion. It gives your team a clear path from the first issue to the final record.
Step 1
Capture daily work
Step 2
Record downtime and effort
Step 3
Track parts and cost
Step 4
Review repeated issues
Step 5
Analyze reports
Step 6
Act on trends
When the team can see what happened, who owns it, what is still pending, and where the proof is stored, maintenance becomes easier to manage every day.
Managers get better visibility before problems become expensive.
Teams can see which assets, locations, or issues consume attention.
Reports become easier to prepare and easier to trust.
Maintenance decisions become based on records, not only opinions.
These MaintBoard capabilities support the day-to-day work behind this problem.
Track maintenance KPIs, downtime, cost, workload, and recurring issues.
See maintenance history, repair records, and asset-level performance.
Connect energy visibility with maintenance and operational decisions.
Capture daily work activity so reports are built from real execution data.
MaintBoard helps turn maintenance work, downtime, parts usage, and asset history into clearer visibility your team can act on.
Practical guides and examples for teams dealing with this maintenance problem.
A practical guide to evaluating CMMS software using real maintenance workflows, user adoption, implementation readiness, compliance, and long-term value—not feature checklists alone.
Read article
Learn how to design a practical functional location hierarchy for CMMS and SAP PM, including thermal power plant examples, naming rules, asset relationships, and configuration mistakes to avoid.
Read article
Practical turnaround planning lessons for thermal power plants and process industries, covering scope control, work packs, contractors, materials, critical paths, commissioning, and startup readiness.
Read article
Learn how to plan, schedule, execute, and review maintenance shutdowns with practical guidance on work scope, spare parts, contractors, safety, scheduling, and CMMS best practices for manufacturing plants.
Read article
Learn how digital twins and CMMS work together to turn equipment condition data into prioritized, completed, and verified maintenance action.
Read article

CMMS trends matter only when they improve daily maintenance execution. Learn which trends help plants reduce missed work, repeat breakdowns, spare delays, and audit gaps.
Read article

CMMS ROI for SMEs comes from fewer missed PMs, faster work execution, reduced repeat breakdowns, better spare control, and cleaner audit records. Learn how to evaluate it practically.
Read article
Excel works for simple lists, but it breaks maintenance control when teams need ownership, due dates, asset history, spare usage, approvals, mobile updates, and audit evidence.
Read article
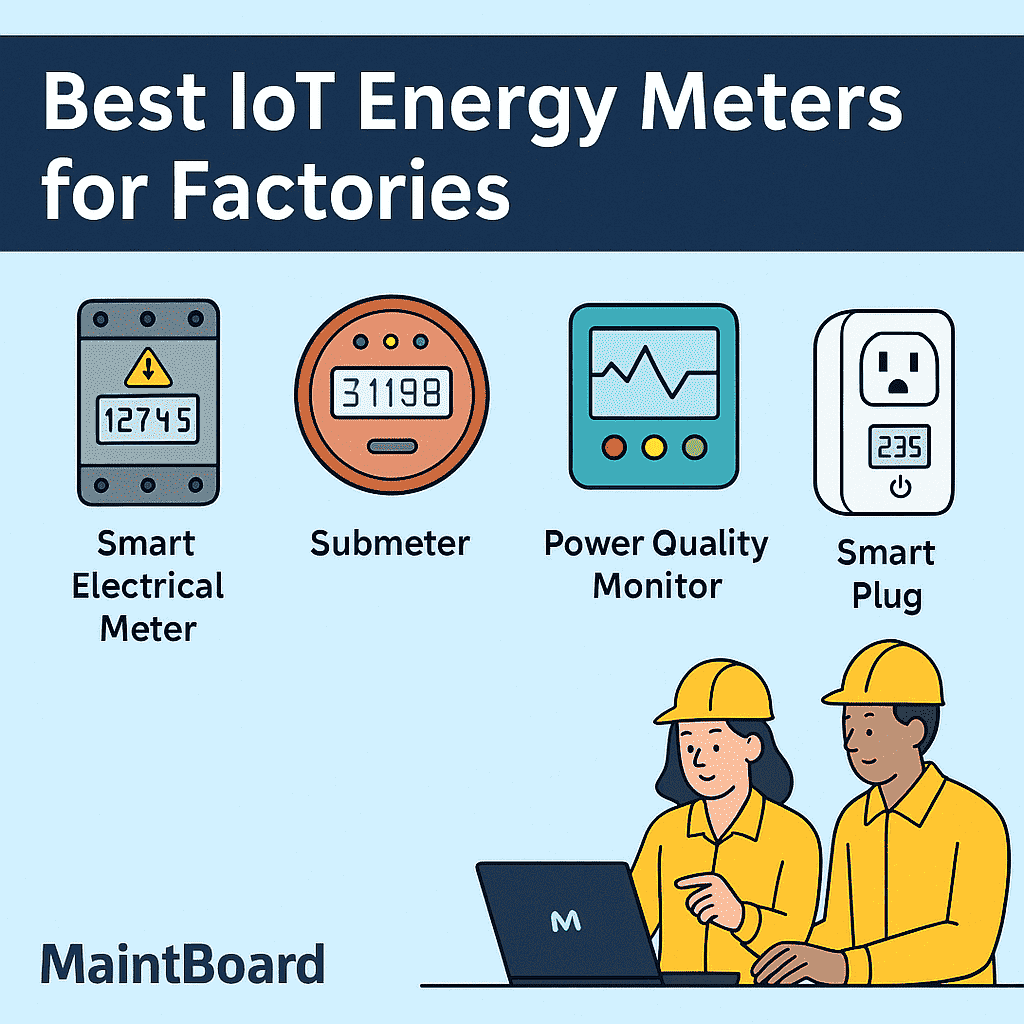
IoT energy meters help factories see consumption patterns, but the real value comes when energy data is connected to assets, downtime, abnormal conditions, and maintenance action.
Read article
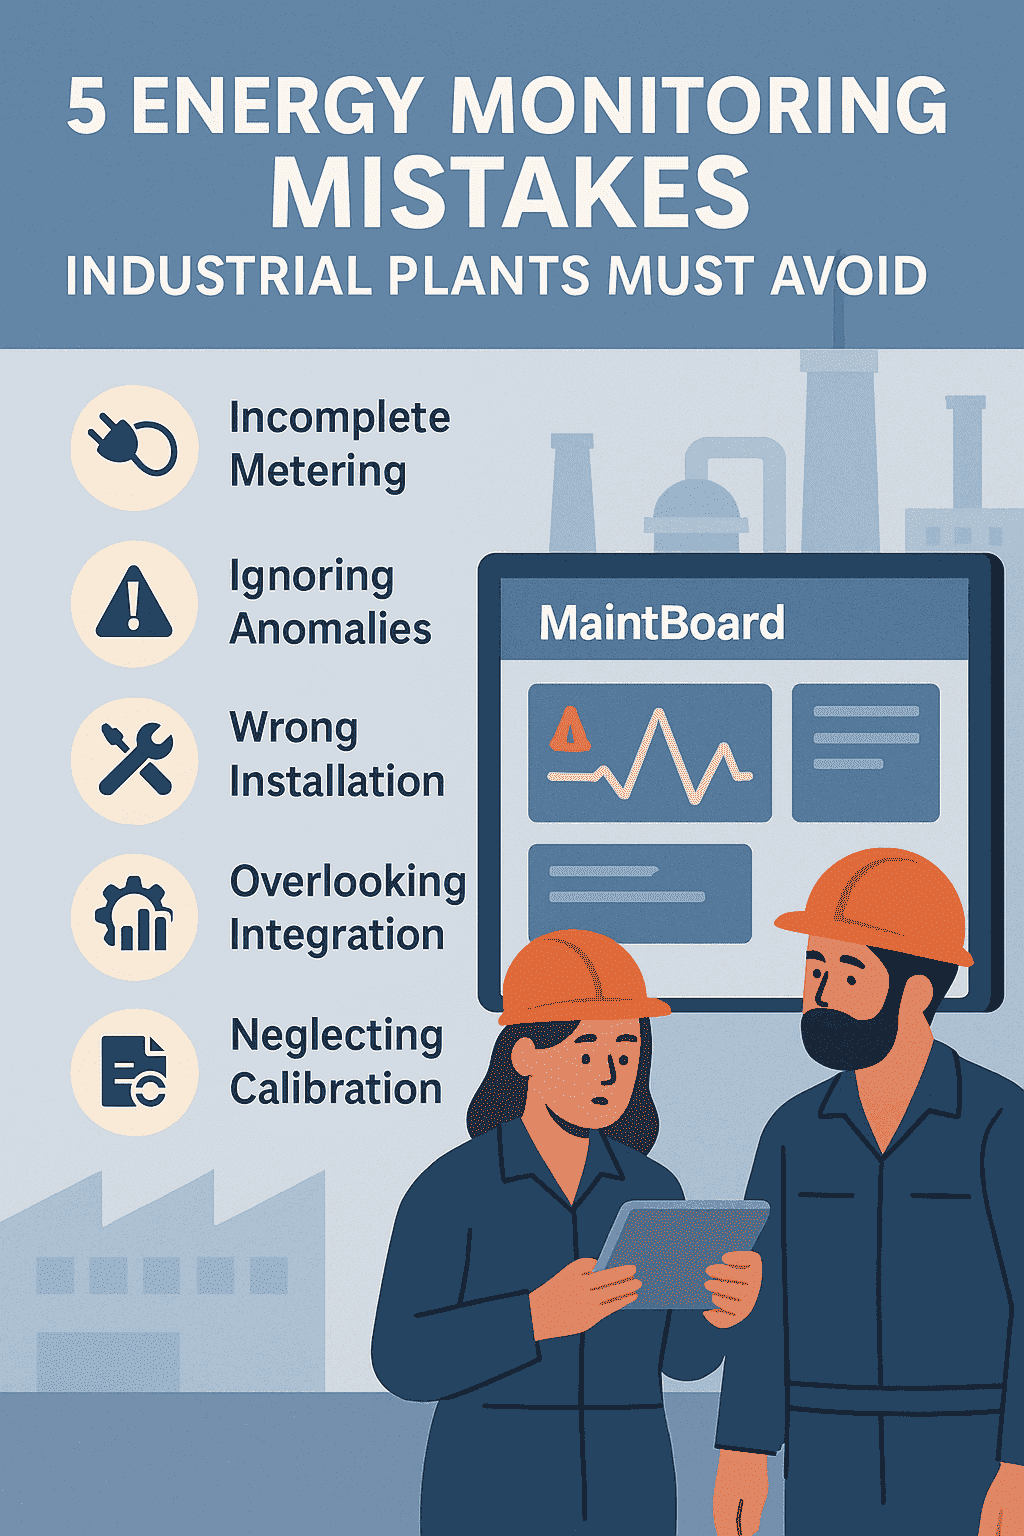
Energy monitoring fails when plants collect meter data but do not connect it to assets, downtime, maintenance work, abnormal conditions, and corrective action.
Read article
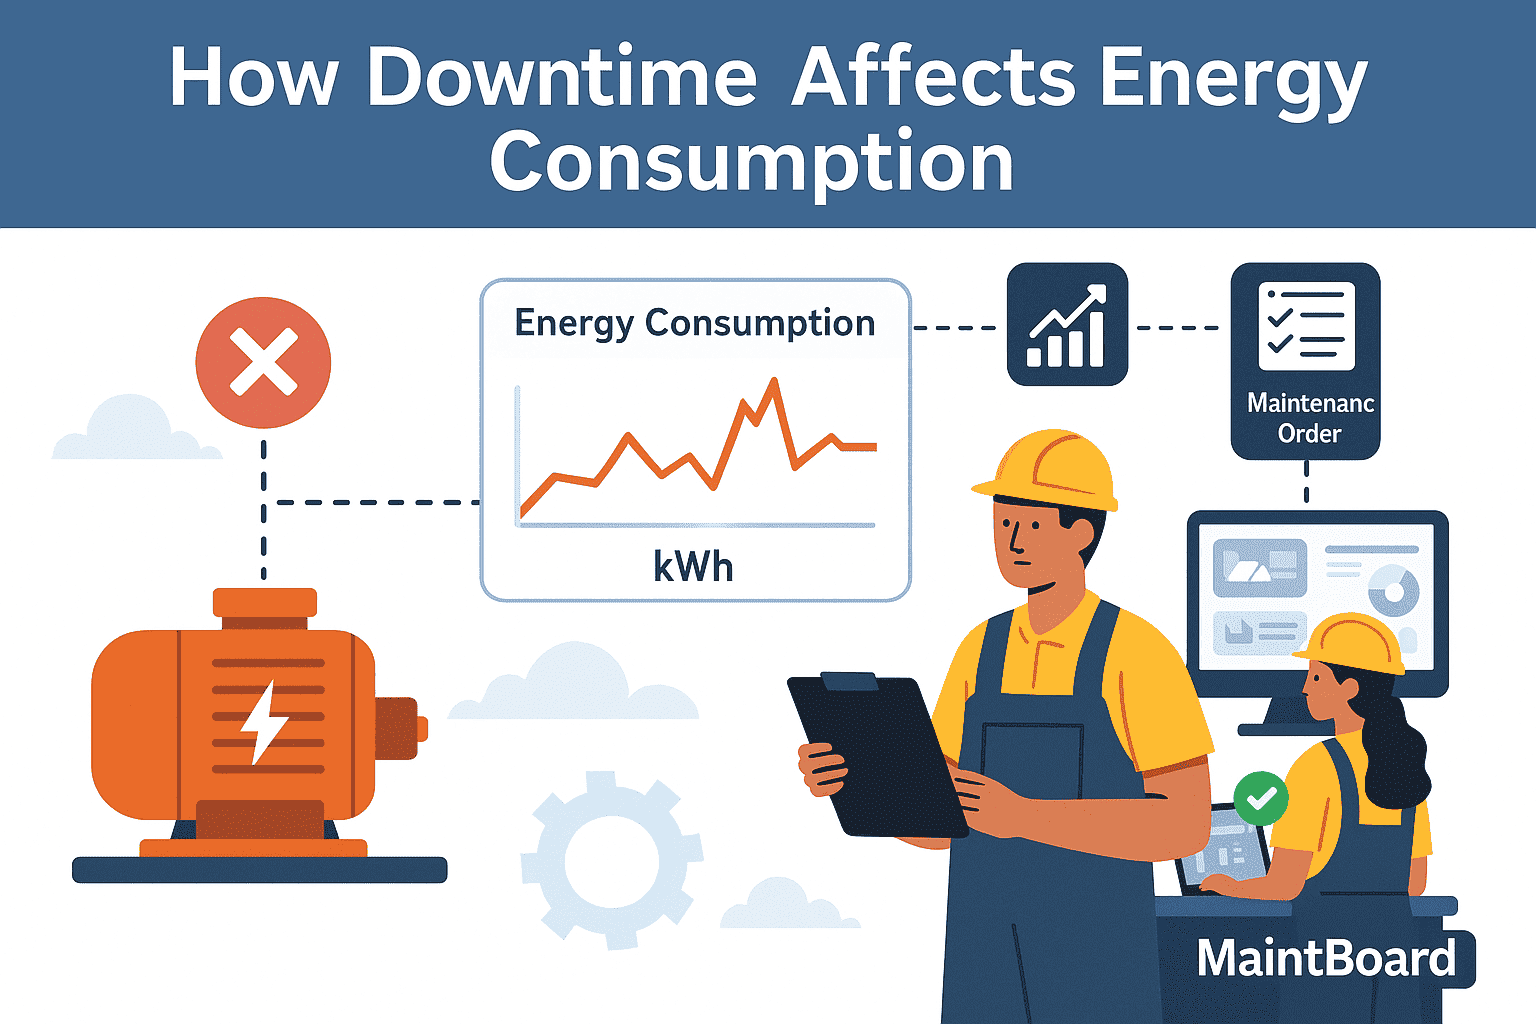
Downtime energy consumption happens when idle machines, utilities, compressors, HVAC, pumps, and support systems keep consuming power even when production is not running.
Read article
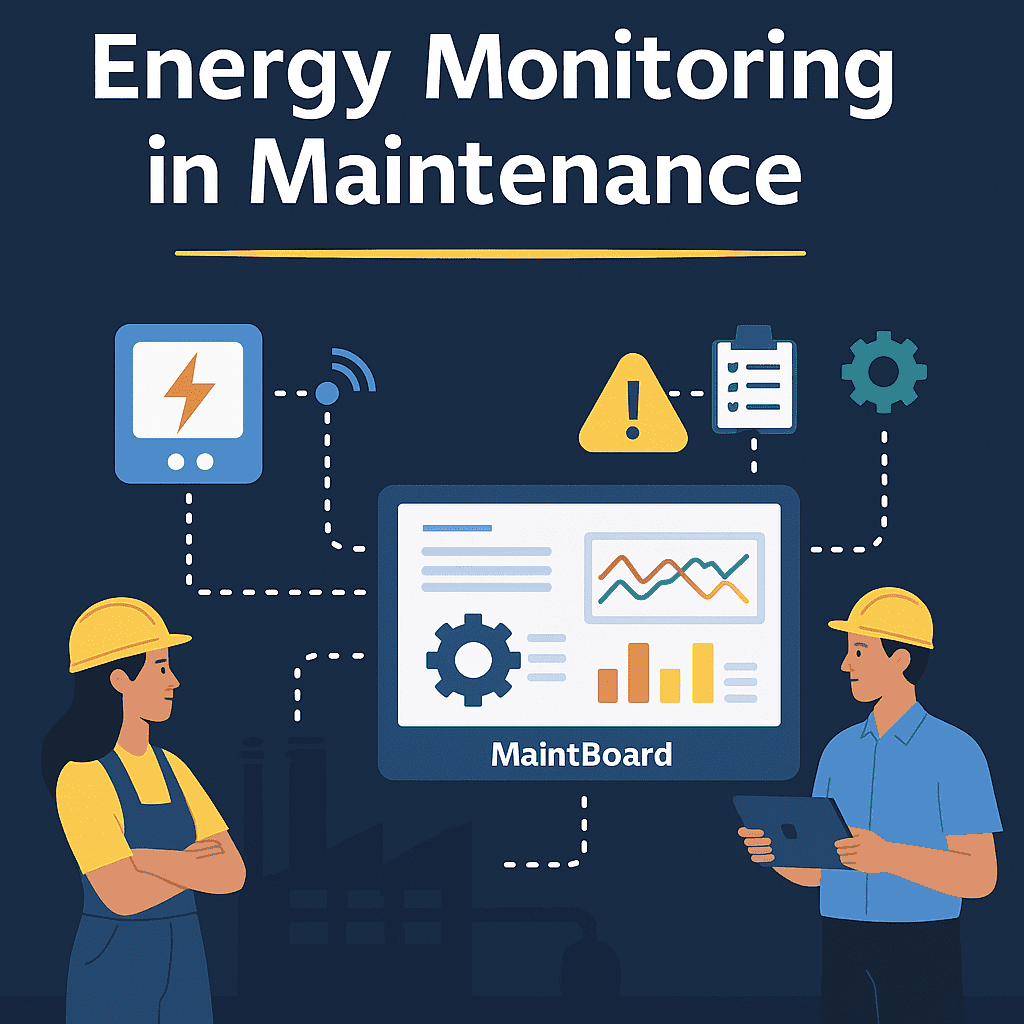
Energy waste often points to maintenance problems such as leaks, worn parts, misalignment, and poor operating conditions. Learn what maintenance teams should monitor.
Read article
Book a MaintBoard demo and see how your team can track downtime, cost, reports, and maintenance trends in one system.